
4 posts tagged with "gpu"

View All Tags

How We Won the 2nd Place in the AI for Earthquake Response Challenge

· 16 min read
Eléonore Charles
Product Manager

This blog post details our approach to the AI for Earthquake Response Challenge, organized by the ESA Φ-lab and the International Charter "Space and Major Disasters". We secured 2nd place among over 250 teams by developing AI models capable of accurately detecting building damage from satellite imagery.

Challenge Overview

When an earthquake strikes, every minute counts. Rapid damage assessments can guide emergency responders to the hardest-hit areas, prioritize resources, and ultimately save lives. But even with access to satellite imagery, the task of mapping damaged buildings is still largely manual, and that takes time.

This is the problem that the AI for Earthquake Response Challenge, organized by the ESA Φ-lab and the International Charter “Space and Major Disasters” set out to address. The mission: build AI models capable of automatically detecting building damage from satellite imagery accurately and at scale.

Post-event Pleiades image over Latakia, Syria with building polygons overlaid

Post-event Pleiades image over Latakia, Syria with building polygons overlaid (categorized by damage field, green = undamaged, grey = damaged) © CNES 2023, distribution Airbus DS.

The competition was structured in two phases to reflect both research and real-world emergency response conditions:

  • Phase 1 (8 weeks) – We received pre- and post-event satellite images for 12 earthquake-affected sites. Each site came with building footprint polygons, and most also included building-level damage labels. The task was framed as a binary classification problem, where each building was labeled as either 0 (undamaged) or 1 (damaged). However, the setup varied:

    • 7 sites were fully annotated and used for training.
    • 4 sites - Adiyaman (Turkey), Antakya East (Turkey), Marash (Turkey), and Cogo (China) - were partially annotated, with some buildings labeled and others left unlabeled. The labeled portion could be used for training, while the unlabeled buildings were evaluated through the live leaderboard, where our predictions were scored against hidden ground truth. The scoring on the leaderboard was based on the F-score metric, which balances precision and recall. For this phase, we could submit predictions every 12 hours to the live leaderboard to see how our models performed.
    • 1 site only included post-event imagery.
  • Phase 2 (10 days) – This was the real stress test. We were given pre- and post-event imagery for 2 completely new earthquake sites. Unlike Phase 1, no labels were provided—only the building polygons. We had to generate predictions directly, without retraining on the new data. Again, the scoring was done via a live leaderboard using the F-score metric. This phase tested whether our models could generalize and remain accurate. For this phase, we could submit predictions every 24 hours to the live leaderboard to avoid overfitting.

More than 250 teams participated, ranging from academic researchers to industry professionals.

Our Approach

To tackle the challenge, we iterated step by step, starting simple and gradually incorporating more complexity as we understood the dataset better.

Data Exploration

The first step was to explore the dataset in detail. We:

  • Plotted the building annotations on the satellite imagery to visually confirm alignment.
  • Worked with GeoPandas and Rasterio to handle building polygons and raster data.
  • Discovered that the dataset was imbalanced, with far more undamaged buildings than damaged ones.

Data exploration showing class imbalance

Data exploration showing class imbalance (more undamaged buildings than damaged ones).

  • Realized that if we wanted to use both pre- and post-event images effectively, we needed to perform image registration. Building annotations were provided only for the post-event imagery, and the pre-event images sometimes came from different satellites with slightly different angles, resolutions, or positions. Image registration adjusts one image so that it spatially aligns with another, ensuring that each building polygon matches the correct location in both images. More details on our registration approach are provided in the next section.

This early exploration shaped our modeling strategy.

First Model: Post-Event Only

As a baseline, we trained a model using only the post-event imagery. To do so, we extracted patches around building footprints.

Example of building patches extracted from post-event imagery used for training

Example of building patches extracted from post-event imagery for training the first model.

We then used fastai with a ResNet34 backbone and the fit_one_cycle training strategy. The task was framed as binary classification: 0 = undamaged, 1 = damaged.

We made a few iterations and the best results were achieved with data augmentation that wielded the following training results:

Training results of our first model

Training results of our first model using only post-event imagery (F-score Valid = 0.89 at epoch 13).

This simple setup already provided competitive scores on the leaderboard.

SCOREADIYAMAN_F1ANTAKYA_EAST_F1CHINA_F1MARASH_F1
Training Post Images Only0.803920.9330.7340.8190.787

Second Model: Pre- and Post-Event with Siamese Network

To leverage both pre- and post-event imagery, we trained a Siamese network. A Siamese network is a type of neural network architecture that takes two inputs and learns to compare them. In our case, the inputs were pre-event and post-event building image patches.

Image Registration

Before feeding the images into the network, we performed feature-based image registration. As explained in the challenge overview, building annotations were only provided for the post-event imagery, and pre-event images sometimes came from different satellites with slightly different angles, resolutions, or positions. Feature-based registration detects and describes distinctive key points in both images, matches them, and computes a transformation to align the pre-event image to the post-event one.

For keypoint detection and description, we relied on modern deep-learning-based local feature extractors, specifically SuperPoint and DISK. We evaluated both methods qualitatively on the dataset and selected whichever produced more reliable and consistent correspondences for a given image pair. The resulting matches were then refined using RANSAC (Random Sample Consensus) to remove outliers and estimate a geometric transformation. This transformation was applied to warp the post-event buildings polygons onto the pre-event image.

This process ensured that each building polygon matched the same location in both images, allowing the Siamese network to accurately detect changes.

Example of registered pre- and post-event images

Example of registered pre- and post-event images.

Siamese Network Training

The Siamese network consists of two identical branches (sharing the same weights) that process each input separately to extract feature representations. These features are then compared — for example, by computing the difference or similarity — to predict whether the building has been damaged. This setup is particularly useful for change detection, because it focuses on differences between the pre- and post-event imagery rather than absolute features in each image alone.

Examples of pre and post-event image patches fed into a Siamese network

Examples of pre- and post-event image patches fed into the Siamese network for training the second model.

The training process was similar to our first model, using fastai and a ResNet34 backbone. This required more coding as the Siamese architecture is not natively supported in fastai.

Training results of our second model

Training results of our second model using both pre- and post-event imagery with a Siamese network (F-score Valid = 0.89 at epoch 14).

This approach improved results overall, though we ran into a challenge with one of the sites.

SCOREADIYAMAN_F1ANTAKYA_EAST_F1CHINA_F1MARASH_F1
Training Post Images Only0.803920.9330.7340.8190.787
Training Pre- and Post-Images0.821160.8890.7500.829*0.848

For the Cogo / China site (*) (one of the four leaderboard sites), the registration did not work well. The pre-event imagery was of much lower resolution than the post-event imagery, making it difficult to find matching key points for alignment. As a result, the patch extraction for pre-event images was not accurate. That is why, we decided to not use Siamese predictions for this site. Instead, we used majority votes on some variants of our first model that use only post-event imagery.

Example of misaligned pre- and post-event patch for the China site after attempted registration.

Example of misaligned pre- and post-event patch for the China site.

Combining Models: Majority Vote

To increase robustness, we combined predictions:

  • For each building, we gathered results from both the post-event-only model and the Siamese network.
  • A simple majority vote was applied to produce the final label.

This ensemble strategy helped balance the strengths of both approaches.

At the end of Phase 1, this approach earned us second place on the leaderboard for phase 1.

Phase 1 leaderboard showing our second place

Phase 1 leaderboard showing our second place (Team: Datalayer).

Note that this was the public leaderboard score. The private leaderboard score could differ. No information about the split between public and private leaderboard sites was provided. Only the final result after Phase 2 was provided.

Phase 2: Predicting on New Sites

In the second phase, we aimed to apply our trained models to new, unseen sites. We received pre- and post-event imagery for two new earthquake sites along with their building annotations, but of course no labels were provided. The first new site was Hatay / Antakya West and contained approximately 19,000 buildings. The second site was Mandalay with, in this case, approximately 447,000 buildings. This high number of buildings posed a computational challenge, as we had to process a large volume of image patches efficiently.

For the predictions, we used the same models as in Phase 1 without any retraining. We applied the same patch extraction, image registration (for the Siamese model), and majority voting strategy for the Hatay / Antakya West site. For the Mandalay site, the same patch misalignment issue as in the Phase 1 China site occurred, so we decided to rely solely on the post-event-only model and its variants for predictions.

At the end of Phase 2, our approach earned us 6th place on the leaderboard for phase 2.

Phase 2 leaderboard showing our 6th place

Phase 2 leaderboard showing our 6th place (Team: Datalayer).

Note that this was the public leaderboard score. The private leaderboard score could differ. No information about the split between public and private leaderboard sites was provided. Only the final result after Phase 2 was provided.

The score on the Mandalay site was particularly low and this is true for all teams. A possible reason is the split between the public and private leaderboard where the public leaderboard was based on a very small subset of the Mandalay site that was not easy to predict. This is just a hypothesis as no information was provided by the organizers about this. But the public phase 2 leaderboard score was obviously not representative of the overall performance on the Mandalay site as we can see from the final results. Note also that some global scores seem inconsistent with the site-level scores. No explanation was provided by the organizers about this.

Final Results

On September 30, 2025, the final results were announced, and we secured 2nd place overall in the challenge. This result takes both phases into account with public and private leaderboard scores with 40% weight for phase 1 and 60% weight for phase 2.

2nd place certificate
RankTeamScore
1stTelepix0.7066794
2ndDatalayer0.6697664
3rdDisasterM30.6597626
4thBadaboum0.6469298

Future Improvements

While our models performed well, there are several avenues for further enhancement:

  • Better pre-event image alignment – Improving registration methods, including testing intensity-based approaches in addition to feature-based ones, could boost Siamese network performance on challenging sites like Cogo/China or Mandalay.
  • Pan-sharpening of imagery – Using panchromatic bands to enhance the spatial resolution of low-resolution color images could improve detection of subtle building damage.
  • Exploring alternative dual-image networks – Testing other architectures designed to process two images simultaneously could outperform the Siamese setup for change detection.
  • Enriching training dataset – Incorporating additional earthquake-related imagery could improve model generalization to unseen regions.

How Datalayer Solution Helped

A big reason we were able to iterate quickly and experiment with different models was the Datalayer solution. With Datalayer, we could:

  • Easily download the 475 GB challenge dataset thanks to the seamless integration of high-capacity cloud storage and compute runtimes.
  • Access GPU runtimes (A100) directly from JupyterLab with 2 clicks, making it straightforward to train our models quickly.
  • Benefit from AI assistance through available Agents, which helped streamline our workflow.
  • Move data between local and remote environments for flexible experimentation.

This allowed our team to focus on modeling and experimentation rather than infrastructure and boilerplate code, which was crucial given the tight challenge timelines.

Notebook in JupyterLab using Datalayer Runtime

Notebook in JupyterLab using Datalayer Runtime with GPU access, integrated cloud data storage and AI assistance.

Main Challenges Faced & Lessons Learned

Along the way, we faced the following main challenges:

  1. Misalignment for some sites – As already mentioned, registration was a major obstacle, particularly for low-resolution or multi-sensor pre-event images (e.g., Cogo/China and Mandalay). The lack of perfect alignment significantly reduced the effectiveness of Siamese networks.

  2. Misalignment even in post-event imagery – For certain sites, even the post-event images were not perfectly aligned with the building polygons. This was not something we could easily fix on our end, and in many cases it appeared to be a data quality issue. This introduced noise in both training and evaluation.

Example of misaligned post-event patches

Example of misaligned post-event patches where building polygons do not match the imagery.

Despite these issues, the competition demonstrated that relatively simple deep learning approaches, when combined with careful data preprocessing, can already provide valuable tools for rapid post-disaster mapping.

A key takeaway from this challenge is that rapid iteration and robust infrastructure are essential. With tight competition deadlines, efficient data access, scalable compute resources, and streamlined experimentation tools were critical for testing multiple approaches and refining our models effectively. From this experience, we also realized that, as many already know, notebooks are excellent for exploration and experimentation, but they can quickly become messy and hard to reuse. Python scripts, on the other hand, are better suited for reusable, modular code. This insight is something we aim to incorporate into the Datalayer solution: enabling seamless work with both notebooks and Python scripts remotely, with easy handling of imports and project organization. If time permits, we would also love to clean up our code and make it publicly available, so others can benefit from our approach. Another insight was that remote-local data transfer is an extremely valuable feature, allowing seamless experimentation between local and cloud environments. However, we noticed it could be improved further to handle larger datasets more efficiently.

We loved taking part in the challenge and are excited to present our solution in Strasbourg on October 6 to the Charter Board. Testing our Datalayer solution against real use cases like this is incredibly valuable. This helps us identify areas for improvement and better understand the needs of data scientists working with geospatial data.

Datalayer: AI Platform for Data AnalysisRegister and get free credits

Datalayer adding GPU to Anaconda Notebooks

· 6 min read
Eléonore Charles
Product Manager

We are thrilled to announce our collaboration with Anaconda, a leader in Data Science and AI platforms. This partnership marks a step forward in our mission to democratize access to high-performance computing resources for Data Scientists and AI Engineers.

Anaconda offers Anaconda Notebooks, a cloud-based service that allows data scientists to use Jupyter Notebooks without the hassle of local environment setup. Through our collaboration, we are enhancing this platform with Datalayer's Remote Runtime technology, bringing seamless GPU access directly to Anaconda Notebooks users.

Why Remote Runtimes and GPUs Matter

In traditional Jupyter Notebook setups, all computations occur locally on a user's machine or a cloud instance. While this setup works well for small to medium-sized tasks, scaling these tasks to handle massive datasets, complex deep learning models, or resource-intensive simulations requires more powerful hardware, such as Graphics Processing Units (GPUs).

GPUs are game-changers for data science and AI because they can parallelize computations, drastically speeding up processes like neural network training, image processing, and large-scale data analytics. However, setting up a local or cloud environment with GPU support can be technically challenging and time-consuming, especially for non-experts.

By upgrading Anaconda Notebooks with Datalayer's Remote Runtime technology, the heavy lifting is done behind the scenes, allowing Anaconda users to focus on what matters most: their data science tasks.

How Datalayer Supercharges Anaconda Notebooks

One of the core advantages of Anaconda Notebooks is its ease of use. Users can quickly launch Jupyter Notebooks with all the libraries and environments they need without the hassle of local configuration. The collaboration with Datalayer builds on this strength, making it incredibly easy for Anaconda Notebooks users to access remote GPU-powered Runtimes.

Users can launch GPU Runtimes directly from the Anaconda Notebooks Jupyter Launcher and switch their Jupyter Notebook to a GPU Runtime with a single click.

info

Anaconda Notebooks is running on an Anaconda managed JupyterHub while Datalayer Runtimes are running on a separated Kubernetes cluster with IAM (Identity and Access Management) and Credits (Usage) integrations.

Architecture Diagram

Benefits for Anaconda Notebooks Users

The collaboration between Datalayer and Anaconda offers several key benefits to the platform's existing and future user base:

  • Enhanced Performance: Users now have access to powerful GPUs without having to manage the underlying infrastructure. This enhancement translates to faster computations and the ability to handle more complex tasks.

  • Cost-Effective Scaling: By leveraging Remote Runtimes, users only consume GPU resources when needed. They can switch between CPU and GPU Runtimes based on the task, optimizing both performance and cost.

  • User-Friendly: The familiar Anaconda Notebooks interface remains the same, with the added option of GPU Runtimes. No additional learning curve or configuration is required, making it accessible even for non-technical users.

  • Broader Use Cases: With GPU support, Anaconda Notebooks users can now tackle a wider range of projects. From deep learning models and complex simulations to high-dimensional data processing, the possibilities have expanded dramatically.

Datalayer provides one-click access to scalable GPU infrastructure, enabling Data Scientists and AI Engineers at all levels to run even the most advanced AI and ML tasks, integrated with the Jupyter Notebook where they are already working.

Jack EvansSr. Product Manager

For any Business in a Whitelabelled Variant

The Datalayer Runtimes are available for any company in a whitelabelled variant.

Integrating managed deployment of Datalayer with your existing Jupyter solution brings a significant advantage for its operators: it allows quick and straightforward installation of a JupyterLab extension and services on Kubernetes, without requiring additional development. This streamlines operations and enables operators to focus on managing the infrastructure, free from the complexities of configuration.

Reach out for more information on how to integrate Datalayer on you Kubernetes cluster and add Runtimes to your existing Jupyter solution.

Conclusion

Our partnership with Anaconda puts the power of high-performance computing at the fingertips of the Anaconda users, while preserving the simplicity and ease of use that Anaconda Notebooks is known for. This collaboration goes beyond simply boosting computational power; it democratizes access to essential tools, empowering Data Scientists and AI Engineers around the world to achieve more, faster, and with greater efficiency. By breaking down barriers, Anaconda and Datalayer are enabling Data Scientists and AI Engineers to unlock their full potential, paving the way for new innovations.

That Beta availabilty was announced at the latest NVIDIA GTC event. Looking ahead, we plan to refine this solution further by enhancing the user interface and incorporating feedback from early users. Additionally, we aim to integrate the GPU Runtime feature into the Anaconda Toolbox.

To learn how to access this feature, visit the official Anaconda GPU Runtimes documentation as well as this Anaconda blog post.

You can register on the Beta waiting list via this link.

Datalayer: AI Platform for Data AnalysisRegister and get free credits

Datalayer Joins NVIDIA Inception

· 3 min read
Eléonore Charles
Product Manager

Datalayer has joined NVIDIA Inception, a program designed to nurture startups that are revolutionizing industries with technological advancements.

At Datalayer, we are focused on providing seamless access to powerful Remote Kernels for data scientists, AI engineers, and machine learning practitioners. Our mission is to simplify workflows and boost productivity by allowing users to leverage GPUs and CPUs without altering their existing code or preffered tools.

Joining NVIDIA Inception will accelerate our development by providing access to industry-leading resources such as go-to-market support, technical assistance and training. This will help us enhance our solutions and collaborate with a network of AI-driven organizations and experts, driving growth during critical stages of product development and enabling us to better serve our users.

Before joining, we were already big fan and users of the NVIDIA GPU technology, with the GPU Kubernetes Operator as documented on the Datalayer Tech GPU CUDA page. We have been supporting Time Slicing and MIG to help optimize costs for our users. We are eager to collaborate with NVIDIA experts to further reduce expenses while enhancing security through sandboxed solutions such as KubeVirt and Kata Containers.

Stay tuned as we continue to develop innovative solutions, now with the support of the NVIDIA Inception Program. We are excited to share our progress with you in the coming months! In the meantime, you can already experiment with NVIDIA GPU on Datalayer.

Datalayer: AI Platform for Data AnalysisRegister and get free credits

GPU Acceleration for Jupyter Cells

· 7 min read
Eléonore Charles
Product Manager

In the realm of AI, data science, and machine learning, Jupyter Notebooks are highly valued for their interactive capabilities, enabling users to develop with immediate feedback and iterative experimentation.

However, as models grow in complexity and datasets expand, the need for powerful computational resources becomes critical. Traditional setups often require significant adjustments or sacrifices, such as migrating code to different platforms or dealing with cumbersome configurations to access GPUs. 
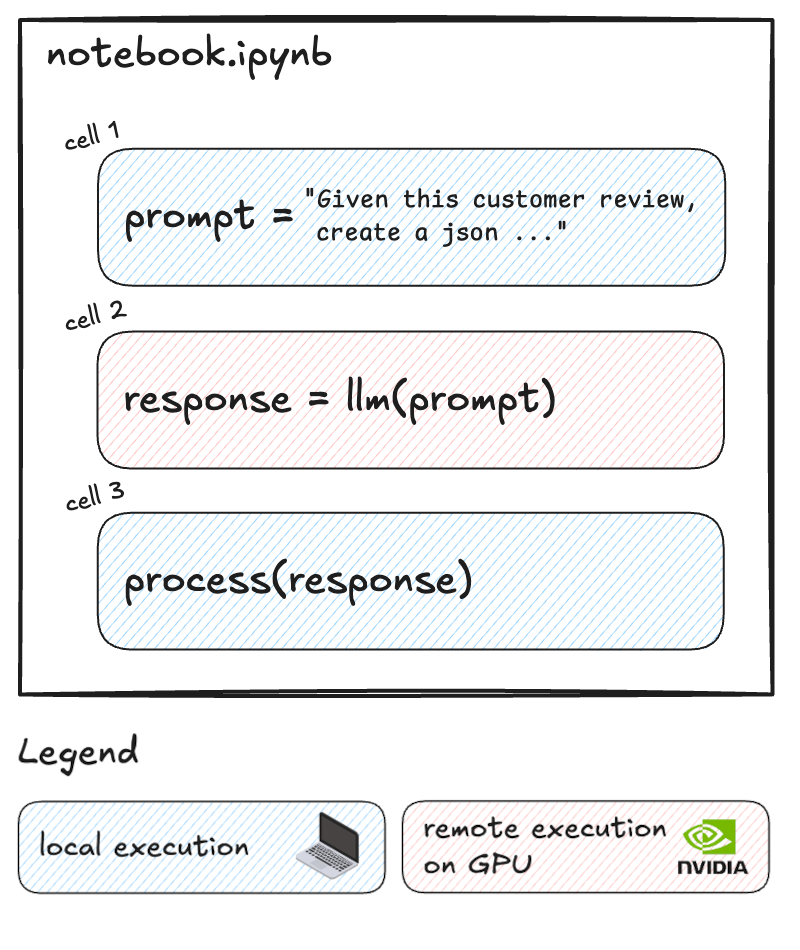
Additionally, often only a small portion of the code requires GPU acceleration, while the rest can run efficiently on local resources.

What if you could selectively run resource-intensive cells on powerful remote GPUs while keeping the rest of your workflow local? That's exactly what Datalayer Cell Kernels feature enables. Datalayer works as an extension of the Jupyter ecosystem. With this innovative approach, you can optimize your cost without disrupting your established processes.

We're excited to show you how it works.

The Power of Selective Remote Execution

Datalayer Cell Kernels introduce a game-changing capability: the ability to run specific cells on remote GPUs while keeping the rest of your notebook local. This selective approach offers several advantages:

  1. Cost Optimization: Only use expensive GPU resources when absolutely necessary.
  2. Performance Boost: Accelerate computationally intensive tasks without slowing down your entire workflow.
  3. Flexibility: Seamlessly switch between local and remote execution as needed.

Let's dive into a practical example to see how this works. We'll demonstrate this hybrid approach using a sentiment analysis task with Google's Gemma-2 model.

Create the LLM Prompt

We start by creating our prompt locally. This part of the notebook runs on your local machine:

prompt = """
Analyze the following customer reviews and provide a structured JSON response for each review. Each response should contain:

- "review_id": A unique identifier for each review.
- "themes": A dictionary where each key is a theme or topic mentioned in the review, and each value is the sentiment associated with that theme (positive, negative, or neutral).

Format your response as a JSON array where each element is a JSON object corresponding to one review. Ensure that the JSON structure is clear and easily parseable.

Customer Reviews:

1. "I love the smartphone's performance and speed, but the battery drains quickly."
2. "The smartphone's camera quality is top-notch, but the battery life could be better."
3. "The display on this smartphone is vibrant and clear, but the battery doesn't last as long as I'd like."
4. "The customer support was helpful when my smartphone had issues with the battery draining quickly. The camera is ok, not good nor bad."

Respond in this format:
[
{
"review_id": "1",
"themes": {
"...": "...",
...
}
},
...
]
"""

Analyse Topics and Sentiment on Remote GPU

Now, here's where we leverage the remote GPU. This cell contains the code to perform sentiment analysis using the Gemma-2 model and the Hugging Face Transformers library. We'll switch to the Remote Kernel for just this cell:

from huggingface_hub import login
from transformers import AutoTokenizer, AutoModelForCausalLM
import torch

# Login to Hugging Face
login(token="HF_TOKEN")

# Load the tokenizer
tokenizer = AutoTokenizer.from_pretrained("google/gemma-2-2b-it")

# Load the model
model = AutoModelForCausalLM.from_pretrained(
"google/gemma-2-2b-it",
device_map="auto",
torch_dtype=torch.bfloat16,
)

# Prepare the prompt
chat = [{"role": "user", "content": prompt},]

# Generate the prompt and perform inference
prompt = tokenizer.apply_chat_template(chat, tokenize=False, add_generation_prompt=True)
inputs = tokenizer.encode(prompt, add_special_tokens=False, return_tensors="pt")
outputs = model.generate(input_ids=inputs.to(model.device), max_new_tokens=2000)

# Decode the response, excluding the input prompt from the output
prompt_length = inputs.shape[1]
response = tokenizer.decode(outputs[0][prompt_length:])

By executing only this cell remotely, we're optimizing our use of GPU resources. This targeted approach allows us to tap into powerful computing capabilities precisely when we need them, without the overhead of running our entire notebook on a remote machine.

To execute this cell on a remote GPU, you just have to select the remote environment for this cell.

This is done with just a few clicks, as shown below:

With a simple selection from the cell dropdown, you can seamlessly transition from local to remote execution.

info

Using a Tesla V100S-PCIE-32GB GPU, the sentiment analysis task completes on average in 10 seconds. The number of tokens/seconds processed is ± 19.

The model was pre-downloaded in the remote environment. This was done to eliminate download time. Datalayer lets you customize your computing environment to match your exact needs. Choose your hardware specifications and install the libraries and models you require.

Datalayer Cell Kernels allow you to manage variable transfers between your local and remote environments. You can easily configure which variables should be passed from your local setup to the Remote Kernel and vice versa, as illustrated below:

This ensures that your remote computations have access to the data they need and that your local environment can utilize the results of remote processing.

info

Variable transfers are currently limited in practice to 7 MB of data. This limit is expected to increase in the future, and the option to add data to the remote environment will also be introduced.

To help you monitor and optimize your resource usage, Datalayer provides a clear and intuitive interface for viewing Remote Kernel usage.

Process and Visualize Results Locally

We switch back to local execution for processing and visualizing the results. This is the processed list of themes and sentiments extracted from the reviews by the Gemma-2 model:

[
{
'review_id': '1',
'themes': {'performance': 'positive', 'speed': 'positive', 'battery': 'negative'}
},
{
'review_id': '2',
'themes': {'camera': 'positive', 'battery': 'negative'}
},
{
'review_id': '3',
themes': {'display': 'positive', 'battery': 'negative'}
},
{
'review_id': '4',
'themes': {'customer support': 'positive', 'camera': 'neutral', 'battery': 'negative'}
}
]

And below is a visualization of the theme and sentiment distribution across the reviews:

Key Takeaways

Datalayer Cell Kernels allow you to selectively run specific cells on remote GPUs. This hybrid approach optimizes both performance and cost by using remote resources only when necessary. Complex tasks like sentiment analysis with large language models become more accessible and efficient.

Check out the full notebook example and sign up on the Datalayer waiting list today and be among the first to experience the future of hybrid Jupyter workflows!

Datalayer: AI Platform for Data AnalysisRegister and get free credits